KS-Agents

Most employee surveys
fail at what comes next.

23% of employees globally are engaged; 9% of global GDP — roughly USD 8.9 trillion — is lost to disengagement (Gallup, State of the Global Workplace 2023). And yet, as Harvard Business Review has documented, most engagement surveys do not move that number: results arrive without action plans, managers fail to follow up, and the survey itself worsens trust (Cunningham & McCarthy, HBR, January 2017). The methodology is not the bottleneck. The bottleneck is what happens between measurement and decision.

Q2

Q2 Pulse · Priorities Alignment

Launched 2026-03-04 · 247 invited
0 / 247 responses
1
Listen
2
Analyze
3
Follow up
4
Guide
Open question · 1 of 6
How clear are this quarter's priorities to you?
IC
IC · Engineering
Honestly, not very. Lots of mixed signals from above.
MM
Middle mgmt · Product
OK in my team but cross-functional priorities feel scattered.
IC
IC · Data Infra
Need more direction on what we deprioritise.
D
Director · Sales
Quarterly OKRs are clear. Steering inputs less so.
AI cluster analysis
247 quantitative + 138 open-text responses
89% confidence
Confusion at IC level
n=78 · ±4pp
62%
Mixed in middle management
n=42 · ±5pp
54%
Aligned at director level
n=18 · ±2pp
89%
Strongest signal: OKR cascade contradicts quarterly steering inputs. 60% of IC mentions
AI follow-up sent to 78 (IC cluster only)
Generated from the IC cluster signal
You said "mixed signals from above" : which signal feels most contradictory right now?
IC
IC · Engineering · anonymous
Quarterly OKRs say speed-to-market. Steering committee asks for reliability. We end up in firefighting mode and miss both.
62 of 78 replied +18h after first survey Synthesizing…
Manager action
Ready for Maria Chen's next 1:1
Hold a 20-minute priority alignment with your team.
Why
6 of your 9 reports flagged contradiction between Q2 OKRs (speed) and steering-committee priorities (reliability).
How
Pick one to deprioritise this sprint. Communicate it explicitly. Revisit at end of sprint.
Reference
Q2 OKR Sheet Steering Notes · Feb 28
Day 1 · Collecting responses

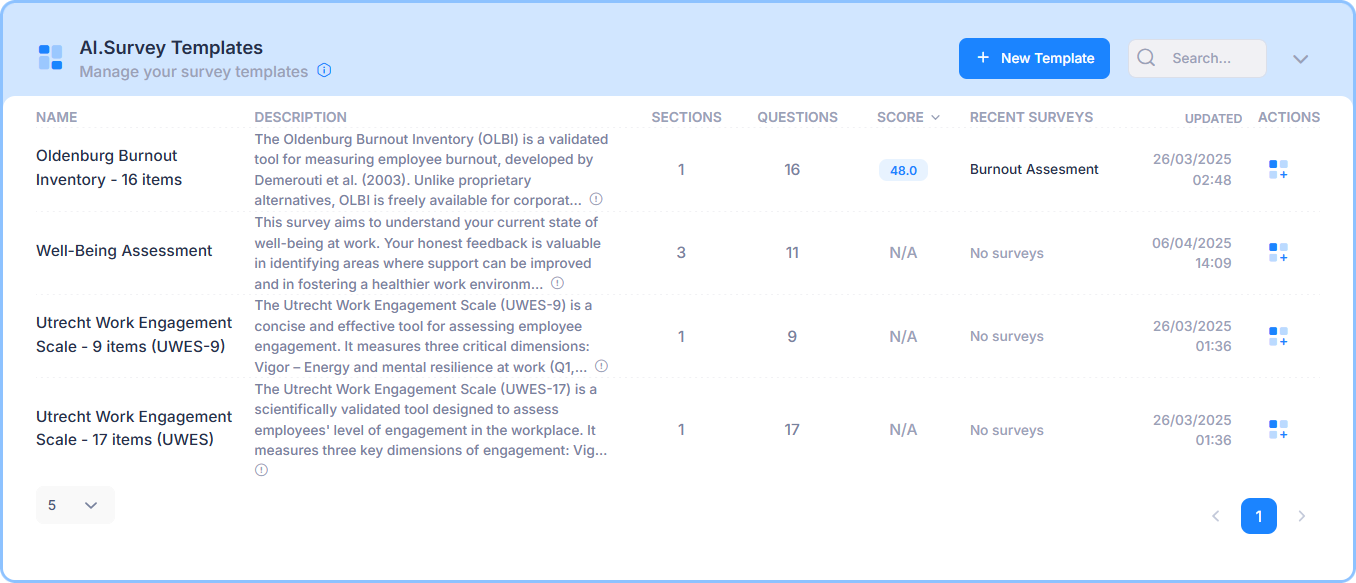
Start from a defensible instrument.

Peer-reviewed scales (UWES — Schaufeli et al. 2006; WHO-5 — Topp et al. 2015 systematic review across 213 studies; OLBI, PHQ-4) coexist with custom dimensions you author. The engine does not force the choice; it enforces the structure underneath both:

  • Item types covering 4- and 7-point Likert, forced-choice, open-ended, dichotomous and numeric inputs.
  • Conditional branching at item and section level, governed by prior responses.
  • Weighted scoring at item, dimension and total-score level — for quantitative assessment of declared psychological constructs.
  • Multi-section instruments with explicit section boundaries and progress signalling.
  • AI synthesis on open-ended responses, with theme extraction and sentiment classification.
Survey Templates

Field with confidence in the response curve.

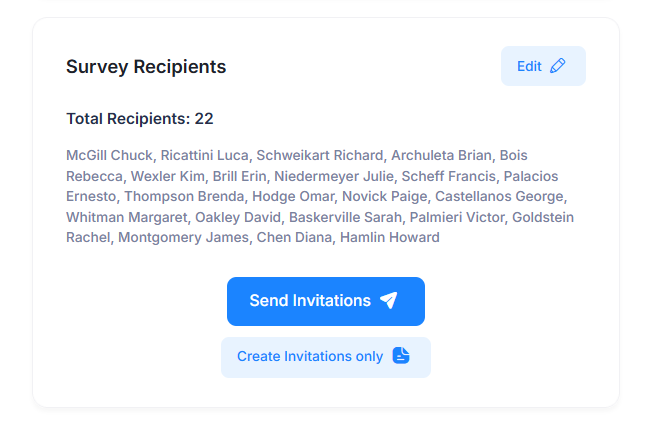
Response rate is the second silent killer of engagement programmes. Targeted fielding, monitored response curve and explicit cohort governance — so the response you get is the response you can defend:

  • Field by organizational unit, defined team, or curated distribution list.
  • Delivery, open and completion tracking, by cohort and by individual.
  • Scheduled reminder cadence for non-respondents — configurable daily, weekly or monthly.
  • Real-time monitoring of response curve and cohort coverage.
  • Anonymous-at-write fielding where required by methodology or legal posture.
Survey Monitoring

Close the gap between numbers and action.

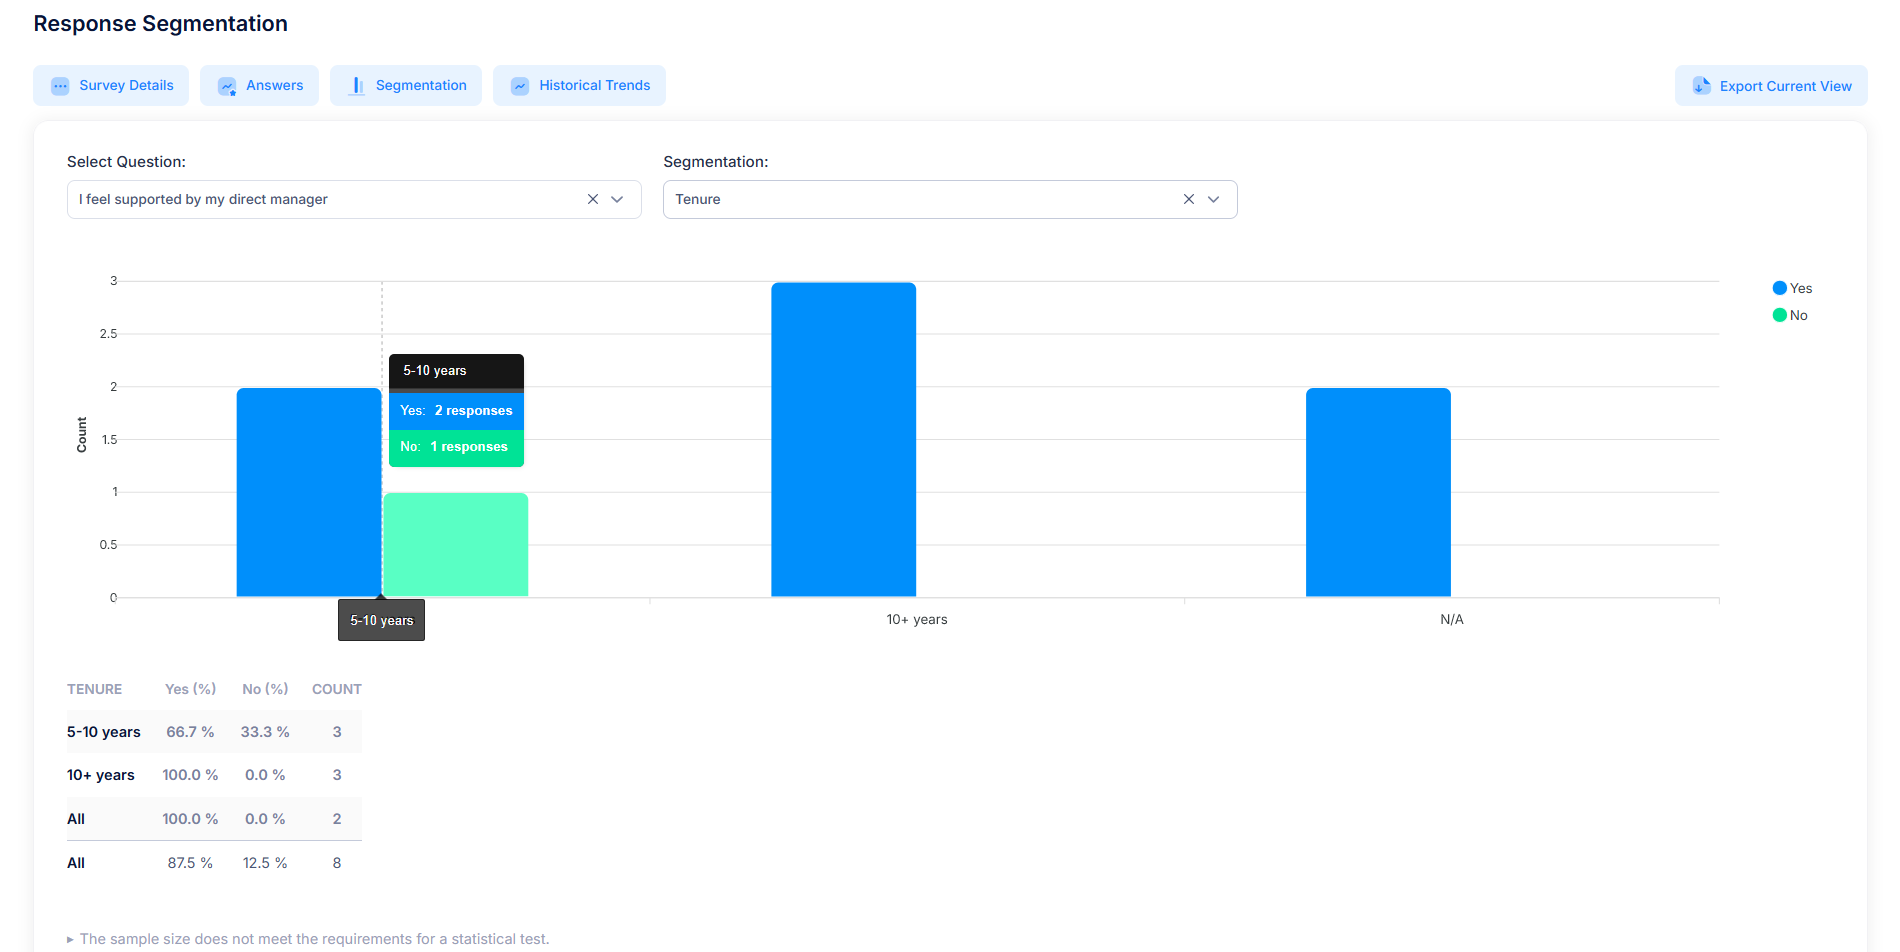
Top-quartile engaged units outperform the bottom quartile by 23% in profitability and 18% in productivity, with 81% less absenteeism (Harter et al., Q12 Meta-Analysis, Gallup, 2020). Capturing that gap requires reading the survey beyond its averages:

  • Theme extraction and synthesis on open-ended responses, with quoted evidence.
  • Statistical significance testing across cohorts and across waves.
  • Cohort segmentation by tenure, function, geography and other declared dimensions.
  • Longitudinal trend analysis across repeated waves of the same instrument.
  • Comparative analysis across cohorts and against historical baselines.
  • Configurable scoring models with declared weights and dimensional aggregation.
  • AI-drafted recommendations grounded in the underlying response data, not in priors.
Survey Analysis

Deliverables the leadership team will actually open.

The deck the C-suite needs and the dataset the analytics team needs — produced from the same source. No second pass, no spreadsheet rework:

  • Pre-structured reports formatted for organizational distribution.
  • Visualizations calibrated for decision-grade reading, not aesthetics alone.
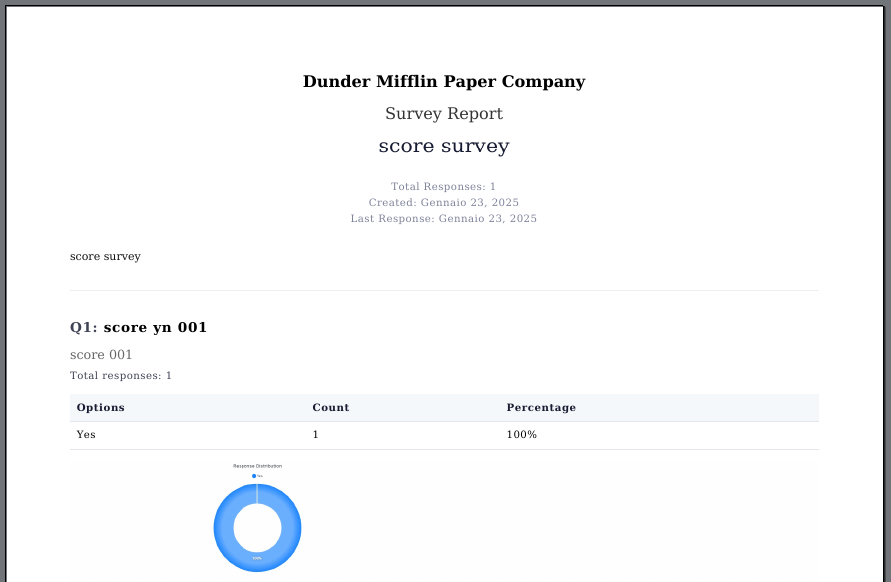
  • Export all survey answers to PDF with charts
  • Export any charts individually
  • Export segmentations charts
  • Export longitudinal trends charts
Survey Reporting

Run your proprietary methodology, defensible at audit.
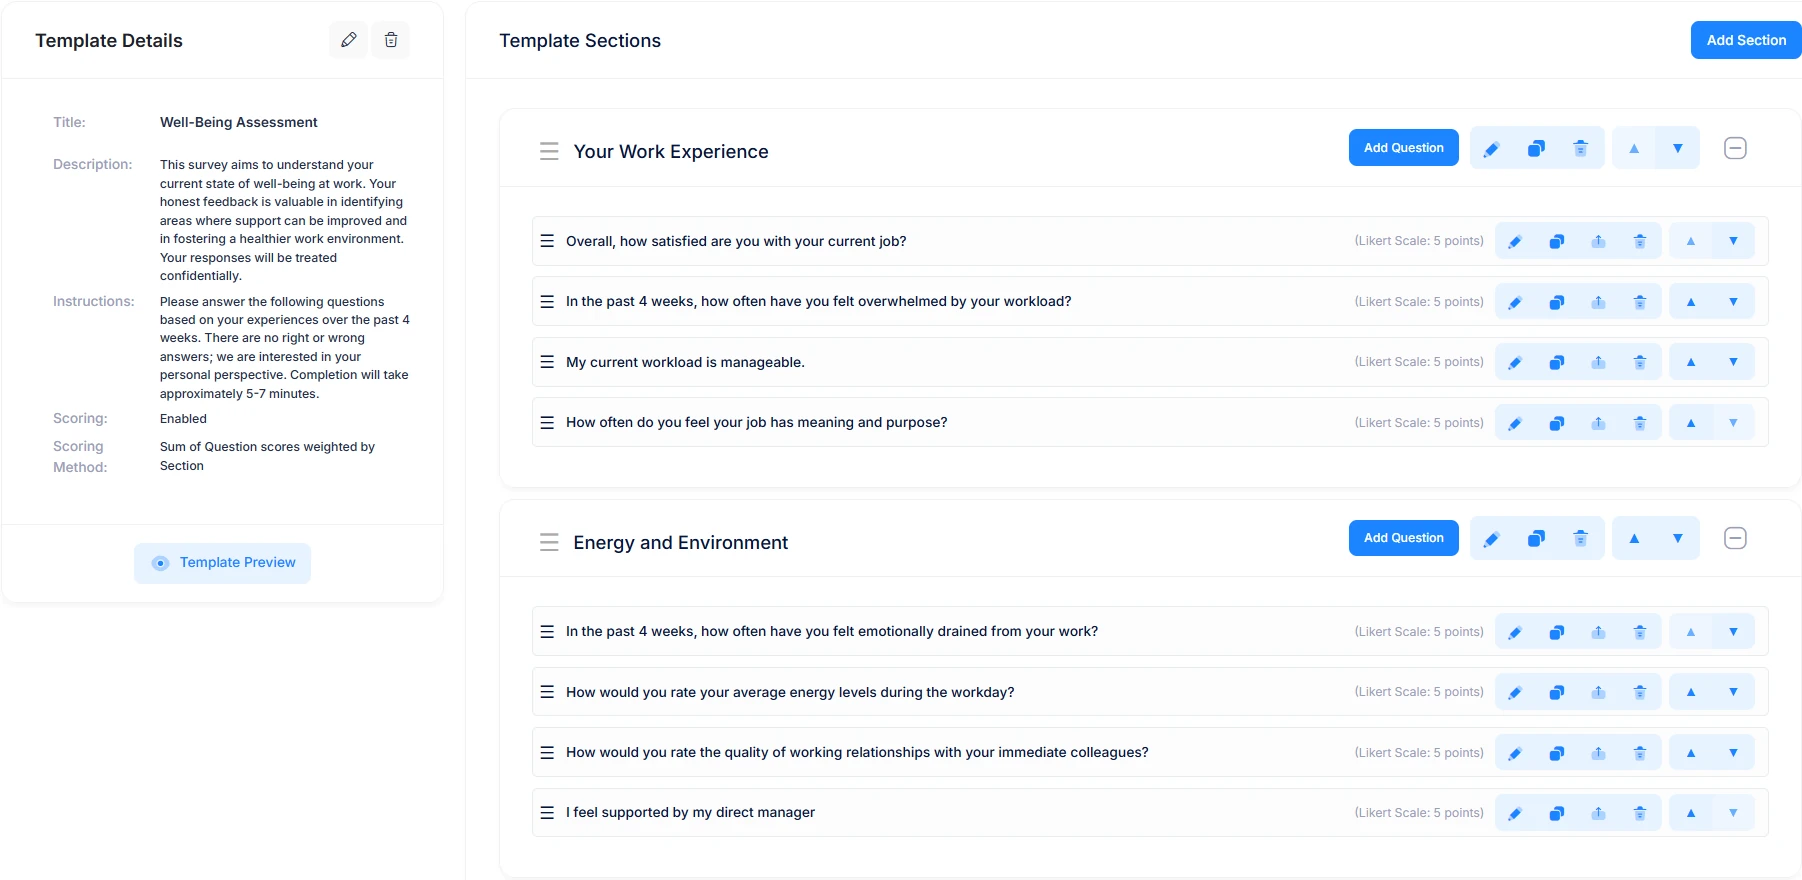
Implement your proprietary instruments on the engine without compromising scientific structure. Configurable at every level — item types (4- or 7-point Likert, forced-choice, open response, numeric), conditional branching at item and section level, declared dimensions with explicit weighting. The engine computes dimensional and total scores; what you ship to the client is a defended methodology, not a generic template.
Example of a Well-Being Survey in KS-Agents

Representative instruments operated on the engine:

  • Employee Engagement Index
  • Well-Being Assessment
  • Team Alignment & Climate
  • Collaboration & Innovation Index
  • Skill Assessment & Gap Analysis
  • Net Promoter Score (NPS)
  • Candidate Experience
  • Onboarding Feedback
  • Stay Interview Insights
  • Mentorship Effectiveness
  • 360-Degree Feedback
  • CSR & ESG Perception
  • Leadership Effectiveness
  • Change Readiness Assessment
  • Diversity & Inclusion Climate
  • Work-Life Balance Survey
  • Training Needs Analysis
  • Internal Customer Satisfaction
Provision the engine
For any request, please contact us

Frequently asked questions

Specifics on the measurement engine, scoring model and governance posture.
What types of questions can I include in my surveys?
Our platform supports a wide range of question types including multiple choice, Likert scales (5-7 points), different length text responses, yes/no questions, and numeric inputs. You can also use conditional questions and sections that appear based on previous answers.
Can I create anonymous surveys?
Yes! You can create fully anonymous surveys where individual responses are hidden and only aggregate statistics are shown. This is perfect for gathering honest feedback while maintaining participant privacy.
How does the scoring system work?
Our advanced scoring system allows you to assign custom weights and metrics to questions, enabling precise calculation of total scores or single numeric responses. The platform supports multiple scoring models and provides sophisticated segmentation capabilities based on demographic data (age, tenure, gender, department, etc.). This allows for detailed longitudinal analysis and trend tracking over time to measure organizational changes and improvements.
How does AI analyze text responses?
Our AI system analyzes free-text responses using advanced natural language processing to identify key themes, sentiment, and patterns. This helps quickly understand large volumes of text responses without having to read through each individual answer manually.
What kind of analytics are available?
Our platform provides comprehensive statistical analysis including descriptive statistics (mean, median, mode, standard deviation), visual representations through boxplots for quartile analysis, and where applicable, tests of statistical significance to validate response patterns and identify meaningful trends.
How can I distribute my surveys?
You can distribute surveys to all registered users/employees, to organization units, teams, or custom mailing lists for non registered users. The system always tracks email delivery, opens, and completions.
What reporting options are available?
Our platform offers interactive graphs and charts for data visualization, with options for segmentation and filtering. You can export data and charts in different formats and generate a PDF multi-page detailed report.
How can I add users/employees to the system?
You can add users individually or in bulk. For bulk import of registered users, simply paste a list containing first name, last name and email address for each user. The system will automatically process the list and create accounts for all users. For mailing lists, you can paste a list of email addresses for simple distribution, or optionally include additional recipient details like first name, last name, organization, notes and other custom fields for segmentation and analysis.
Method or governance questions outstanding?
Contact Support